


 139 / 144

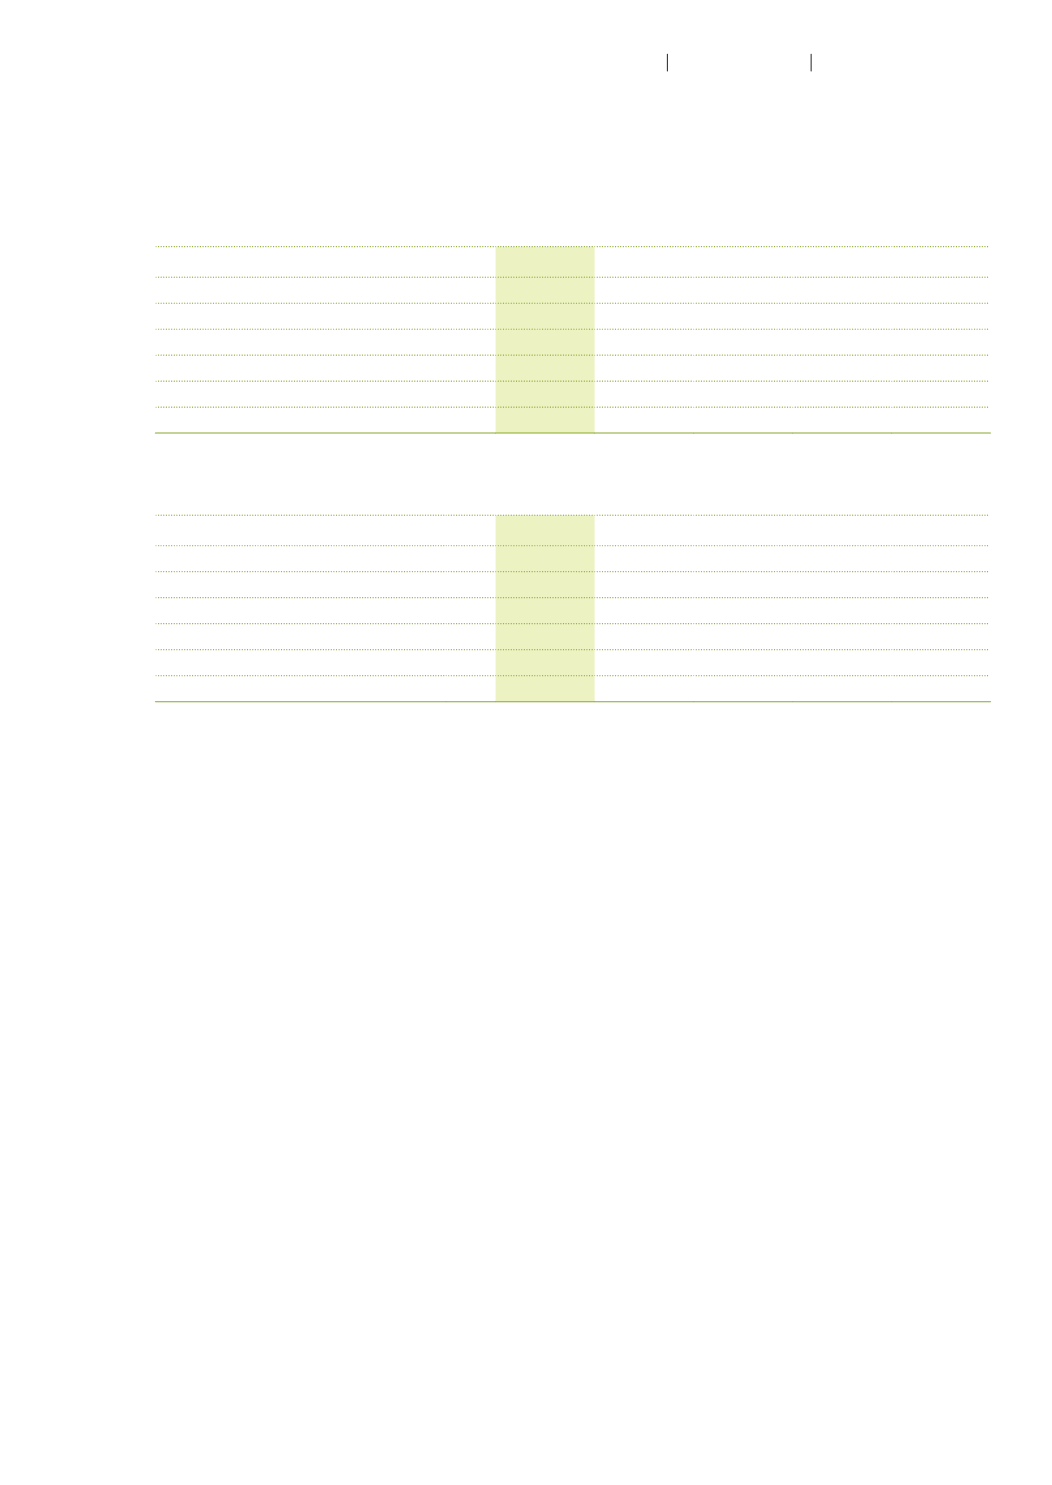
Information for investors
CHF million
2016
2015
2014
2013
2012
Number of issued shares
4 672 363 4 672 363 4 672 363 4 672 363 4 672 363
Share capital of Autoneum Holding Ltd
0.2
0.2
0.2
0.2
0.2
Net profit of Autoneum Holding Ltd
61.8
19.8
11.9
13.4
8.2
Market capitalization at December 31
1 243.4
938.1
783.0
633.3
207.1
as a % of net sales
57.8% 45.0% 40.1% 30.8% 10.7%
as a % of equity attr. to shareholders of AUTN
315.4% 311.3% 258.0% 271.9% 97.2%
Data per share (AUTN)
CHF
2016
2015
2014
2013
2012
Basic earnings per share
20.61
9.12
17.03
3.12
2.61
Dividend per share
1
6.50
4.50
4.50
1.30
0.65
Shareholders’ equity per share
2
84.74
65.01
65.71
50.24
45.65
Share price at December 31
267.25
202.40
169.50
136.60
44.35
Share price development during the year
High
290.00
226.40
209.30
140.00
57.95
Low
185.00
148.40
129.10
43.30
36.00
1
As proposed by the Board of Directors and subject to the approval of the Annual General Meeting.
2
Equity attributable to shareholders of Autoneum Holding Ltd per share outstanding at December 31.
135
Autoneum
Financial Report 2016
Review 2012–2016