


 4 / 130

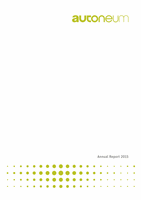
CHF million
2014
2015
Operating cash flow
138.2
143.2
*
CHF million
2014
2015
Net profit
102.8
36.2
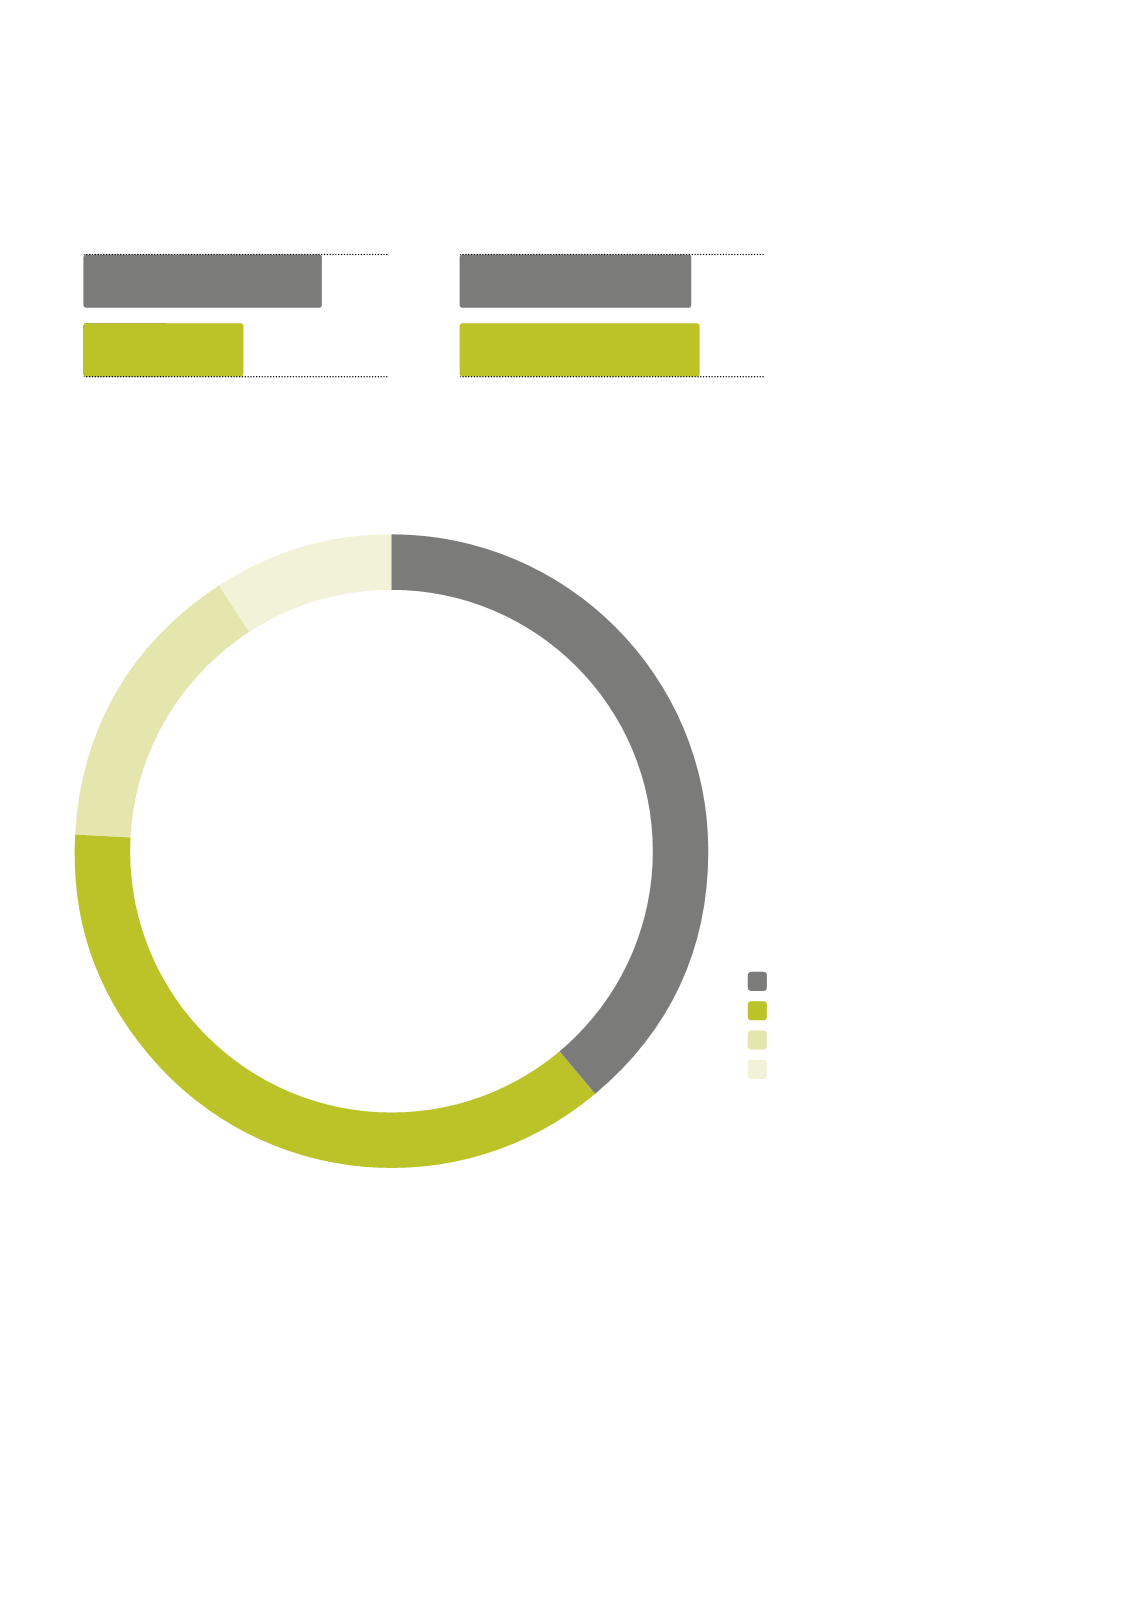
68 7
9%
39%
37%
15%
Business Group Europe/Corporate
Business Group North America
Business Group Asia
Business Group SAMEA
Employees
by region
*before non-recurring expenses