


 4 / 144

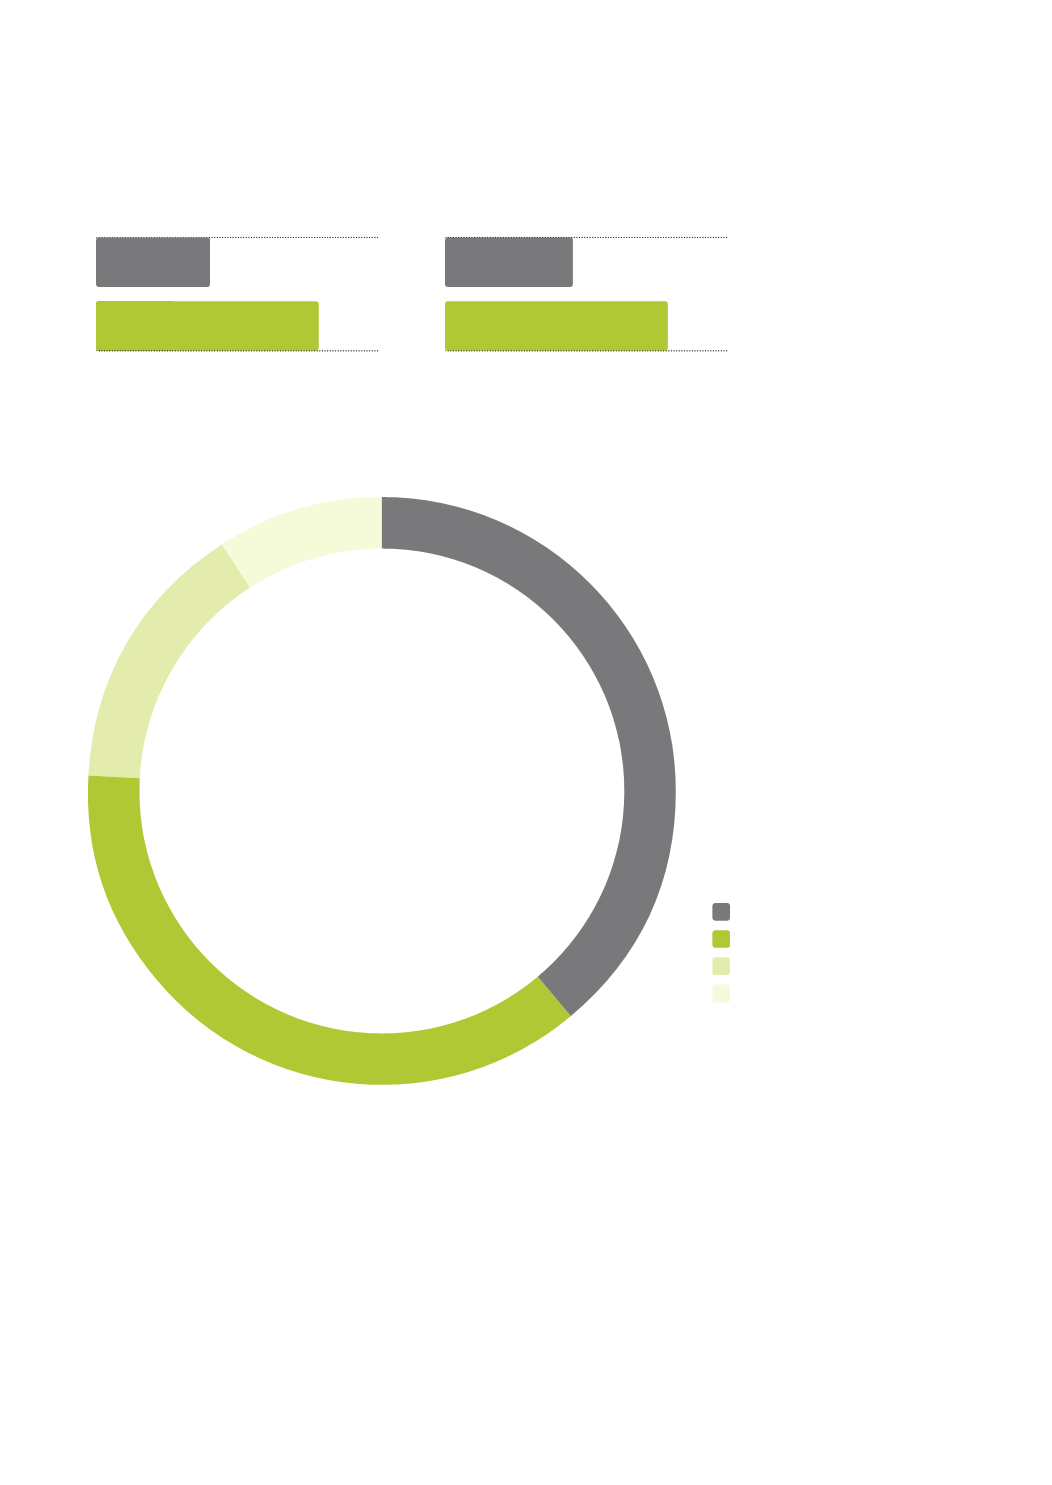
CHF million
CHF million
36.2
2015
2016
Cash flow from operating activities
111.7
194.1
2015
2016
Net profit
68.7
133.8
Employees
by region
16%
8%
39%
37%
Business Group Europe and Corporate
Business Group North America
Business Group Asia
Business Group SAMEA